The question
Do patients who report a transportation barrier experience measurably different healthcare journeys than otherwise similar patients?
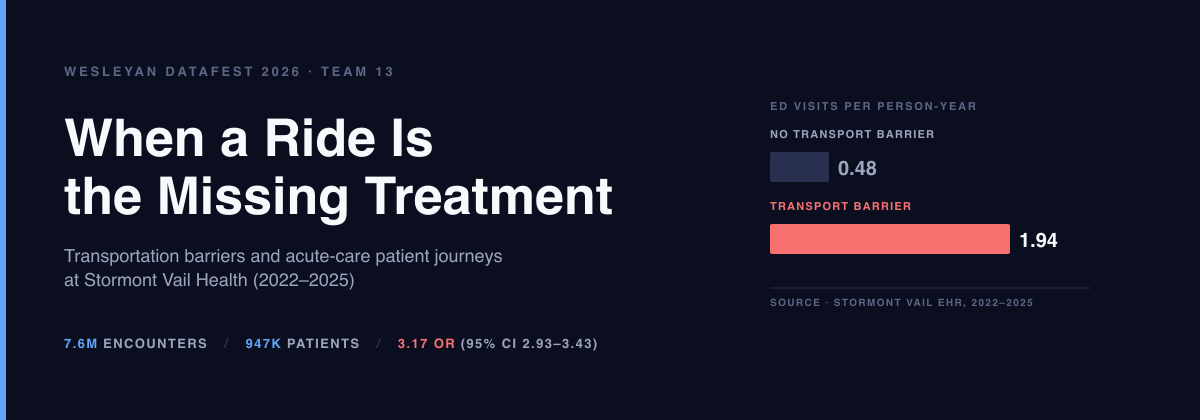
Yes. They visit the emergency department 3× as often — and the gap survives age and sex adjustment, and persists inside every chronic-disease cohort I checked.
The answer
-
3.17
Adjusted OR
for any ED visit 95% CI 2.93–3.43 -
1.94
ED visits per
person-year vs 0.48 with no barrier -
68%
had any ED visit
in the window vs 43% with no barrier -
63%
had any inpatient
admission vs 35% with no barrier
ED visits per person-year, by cohort
n = 58,639 screened patients. Barrier cohort n = 2,986; no-barrier n = 55,653. Full numbers in the writeup →
Why I believe it
Three robustness checks
It survives age and sex adjustment
Logistic model outcome ~ transport + age + sex on n = 58,639 screened patients.
Adjusted OR 3.17 (95% CI 2.93–3.43) for any ED use. Barrier patients are also
younger (median 51 vs 61), so this isn't an age artifact.
It replicates inside every chronic disease
Restricting to patients with hypertension, type 2 diabetes, CKD, or AFib index encounters, the 180-day ED-return rate roughly doubles:
- Hypertension (HTN): 33% vs 15% (2.2×)
- Type 2 Diabetes (T2D): 40% vs 17% (2.4×)
- Chronic Kidney Disease (CKD): 37% vs 21% (1.8×)
- Atrial Fibrillation (AFib): 34% vs 24% (1.4×)
The scale is real
7,675,801 encounters across 947,685 patients, 2022-01-01 through 2025-12-31. A 12-domain social-determinants questionnaire identifies the cohort. The effect is robust to multiple cohort definitions and outcome variants.
What it means
A single question — “Has lack of transportation kept you from medical appointments?” — identifies a cohort with ~3× odds of acute-care need, independent of age.
This is a high-yield intervention target: reliable rides, co-located pharmacy delivery, tele-visits for chronic-disease follow-up, and case management. Acting on the transport answer that Stormont Vail already collects is a concrete next step.
Honest limits
The data is observational and the screening sample is non-random. Only ~6% of patients in the release have any SDOH answer, so absolute prevalences shouldn't be projected to the full system. 20% of encounter rows carry a diagnosis key not in the lookup; 65% of patients have no parseable FIPS code, so no geographic model was fit. Patient journeys are left- and right-censored at the 2022–2025 window. The writeup spells out the full caveat list.
Read the analysis